Health and allied services businesses grow by adding sites. Each addition looks like a copy of the last one. Very few of them are.
A second location, a third entity, a new discipline under the same brand: each arrives with its own rostering habits, its own referral relationships, its own way of recording the same thing. The business is multi-site long before its operating model is.
Here is where the value goes, based on the areas a whole-business review examines most closely in this sector.
Rostering and utilisation
Clinical time is the product. It is also the least visible thing on most management reports, which tend to show revenue by site rather than utilisation by practitioner.
The gap between booked and available hours is usually known locally by whoever builds the roster. It is rarely aggregated, which means nobody can see whether one site is carrying a systemic gap while another turns work away.
The upside beside it: capacity that already exists, already paid for, currently unbooked. Reaching it needs no new hire.
Administration repeated per site
Every site develops its own way of handling intake, consent, recalls and billing queries. Each version works. The cost is that the same task is designed five times, then maintained five times.
This is rarely visible as a line item because it is distributed. No individual site sees anything unusual. Only a view across all of them shows that the business is paying for five processes where one would serve.
The upside beside it: a single process, once designed properly, raises the floor everywhere rather than the ceiling in one place.
Referral and intake friction
Referrals arrive by whatever route the referrer prefers, which after a few years means several routes with different completeness. Somebody chases the gaps.
The measurable version of this problem is time from referral to first appointment, split by route. Most businesses can produce that number only with effort, which is itself the finding.
The upside beside it: referrers respond to responsiveness. A business that answers faster than the alternative wins volume without spending on acquisition.
Systems bought per site rather than per business
A practice management system chosen for one location, then repeated as the business grew, produces several instances of the same product that cannot see each other.
The result is a business that cannot answer questions about itself without somebody assembling the answer by hand. That assembly is a recurring cost. The delay it introduces changes decisions.
The upside beside it: the licences are frequently already sufficient. What is missing is configuration and the decision to standardise, not new spend.
Compliance work done twice
Regulated businesses keep records because they must. The problem is not the records. It is that the sanctioned system often exists to satisfy an auditor while the real coordination happens somewhere else, in a spreadsheet or a message thread.
That means the same information is captured twice, in two places, with the operational version being the one people trust. An audit passes. Nobody has operational control.
The upside beside it: when the compliance record and the working record are the same record, an entire category of duplicate effort disappears.
Why these are hard to see from inside
None of these is a failure. Each one is a reasonable local decision that made sense when it was taken.
They are hard to see because:
- The cost is distributed across sites rather than concentrated
- The people best placed to notice are the ones absorbing the extra work
- Each site compares itself to its own history rather than to the others
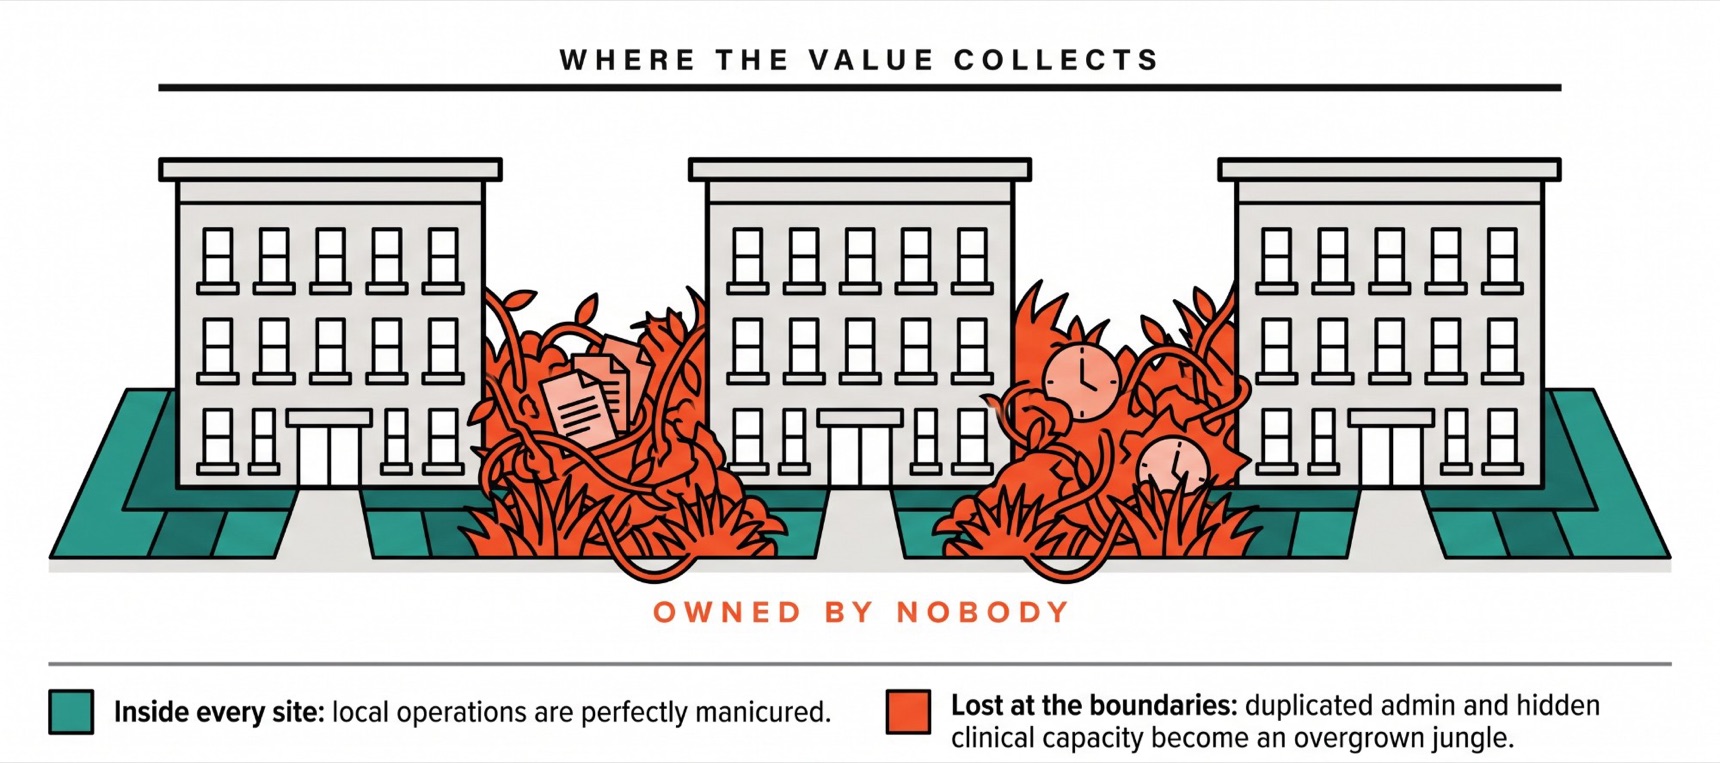
- Nobody owns the space between sites, which is where most of it sits
That last point is the important one. Every item above lives at a boundary. Boundaries are where ownership is weakest, which is exactly why value collects there unnoticed.
The order they should be tackled in
Not the order above, which is thematic. The order depends on what the evidence says each is worth in a given business, which varies more than people expect.
What does hold across most of them is that the cheapest wins usually sit in capability already bought. Configuration, standardisation and training move faster than procurement. They also carry far less risk.
Where these numbers already exist
Every item above is already being recorded somewhere. The difficulty is that it is recorded per site, so nobody sees the pattern across the group.
| Where to look | What to pull | The measure |
|---|---|---|
| Practice management: Cliniko, Halaxy, Nookal, Best Practice, Gentu | Booked hours against available hours, by practitioner, by site | Utilisation. The single most useful number in this sector |
| The same systems | Non-attendance and late cancellation rates, by site and by referral route | Where capacity is being lost after it was won |
| Referral inbox, fax queue, e-referral portal | Date received against date of first appointment | Time to first appointment, split by route |
| Accounting: Xero, MYOB | Revenue per practitioner hour, by site | Whether sites differ in mix, in pricing or in leakage |
| Payroll and rostering | Roster hours against clinical hours delivered | The gap between what was paid for and what was delivered |
| Any system, counted by hand | How many places one patient detail is entered | Duplication, measured in keystrokes |
Pull utilisation first, by practitioner rather than by site. Site averages hide the thing you are looking for, which is one location carrying a systemic gap while another turns work away.
The standard worth setting: a group-wide target for time from referral to first appointment, published to referrers. Referrers respond to responsiveness. A business that can commit to a number wins volume without spending anything on acquisition.
A caution on comparing sites. Two locations recording the same event differently will produce a difference that is a data problem rather than a performance one. Check the definitions match before drawing a conclusion about anybody.
Which of these could you answer about your own sites today?
Utilisation by practitioner across every location. Time from referral to first appointment by route. How many places the same patient detail gets entered.
If any of those would take somebody a day to assemble, that difficulty is the finding. It means the business cannot currently see itself clearly enough to know where its capacity is going.
The Free Health Check scores the six areas these questions sit in, in about three minutes. If you want the answers evidenced across every site rather than estimated, how we work explains what that involves.